Tip
TipThis page represents the data of an Inventory items as per various filters and categories in the following charts:
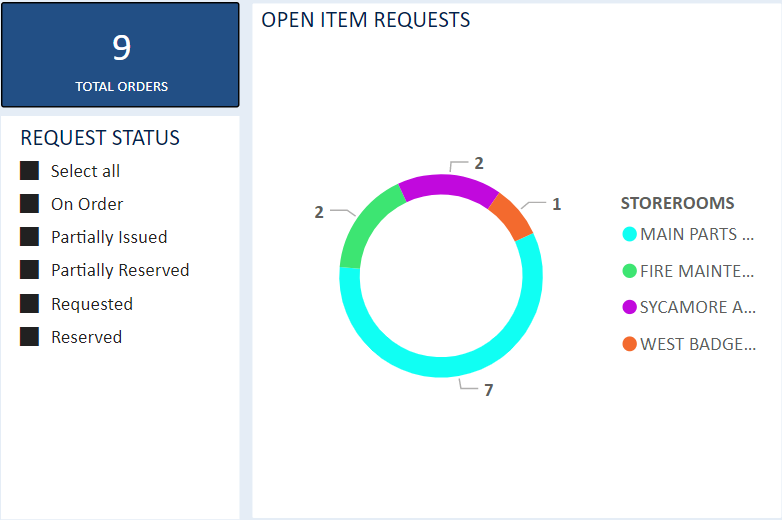
The objective of this chart is to display the number of Inventory Item Requests in each request status. This will provide the inventory storeroom personnel an idea of what are the priority requests and what is the next course of action that needs to be taken for each request.
This chart displays all requests for the status including On Order, Partially Issued, Partially Reserved, Requested, Reserved, Issued, and Part Vendor Issued. A Pie chart is used to show Count of Open Item Requests Storeroom.
Legend lists the Storeroom from the dimension table.
Values lists the Count of Open Item Requests.
The Filter used as a Request Status to display the count of Assets in each Storeroom, Request Status.
Right-click on any legend, to open the Drill Through option which navigates to a new page. The Drill Through is used to display the details of the chart with columns Item Number, Document Number (Work Order Number), Request Status, and Date Requested.
Note: Data for this chart will be refreshed for every 30 minutes.
Tip
To view the Open Item Requests chart, click the Open Item Requests Chart link.
Features of the chart:
Hover over the chart to display the values of Storeroom description and count of Open Item Requests.
Show as Table: You can see the chart values in a tabular format. From the chart More Options (...), select Show as Table option. All the fields used for the chart can be shown in the table view.
Focus Mode: You can see full page view of the chart using the Focus Mode option from the chart ellipse.
Export: You can export chart data to .csv format from the Export Data option in the chart ellipse.
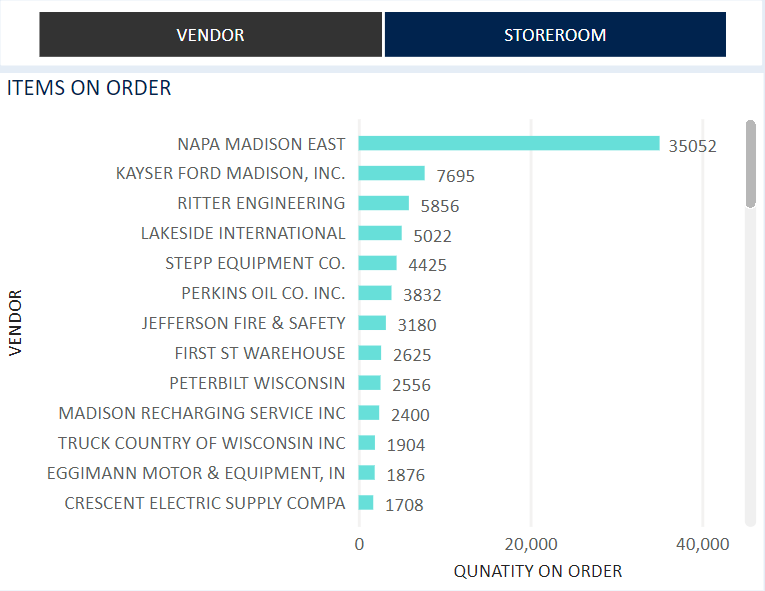
The objective of this chart is to show current open orders. This helps the Inventory personnel to understand which items are on order, so they do not order them again. A Clustered Bar chart is used to display Items Count against Storeroom/Vendor.
The condition for Order Status = 'Open' AND Line-Item Delivery Status = 'On Order' OR 'Partially Received'
X Axis lists the Items Count.
Y Axis lists the Dynamic fields (Storeroom and Vendor).
Note: The Y Axis lists the Storeroom/Vendor Description. The RLS (Row Level Security) will not be applied for this chart and the data will be displayed irrespective of the user.
The Filter uses a Slicer to select Storeroom OR Vendor. This Slicer is common for Items on Order chart and Items Below Reorder Point chart. The selection of the value from the slicer will affect both the charts.
Right-click on any legend, to open the Drill Through option which navigates to a new page. The Drill Through is used to display the details of the chart with columns Order No, On Order Qty, Storeroom/Vendor.
Note: Data for this chart will be refreshed for every 30 minutes.
Tip
To view the Items On Order chart, click the Items On Order Chart link.
Features of the Chart:
Hover over the chart to display the values of Vendor/Storeroom name and Quantity On Order.
Show as Table: You can see the chart values in a tabular format. From the chart More Options (...), select Show as Table option. All the fields used for the chart can be shown in the table view.
Focus Mode: You can see full page view of the chart using the Focus Mode option from the chart ellipse.
Export: You can export chart data to .csv format from the Export Data option in the chart ellipse.
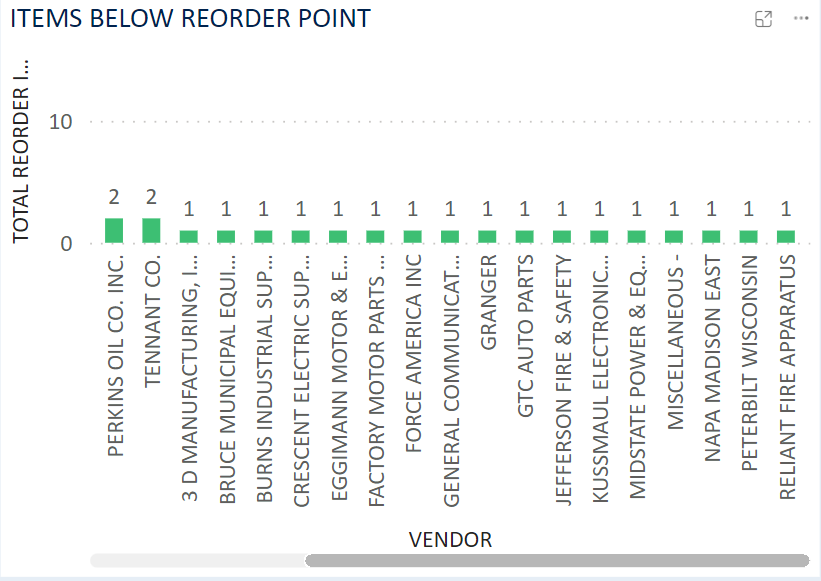
The objective of this chart is to provide a list of inventory items that have reached their reorder point. A Clustered Column chart is used to display Items Count of Items against Storeroom/Vendor.
The condition for Quantity in Stock <= ReorderPoint
X Axis lists Items Count
Y Axis lists Dynamic Fields (Storeroom and Vendor)
Note: The Y Axis lists the Storeroom/Vendor Description. The RLS (Row Level Security) will not be applied for this chart and the data will be displayed irrespective of the user.
The Filter uses a Slicer to select Storeroom OR Vendor. This Slicer is common for Items on Order chart and Items Below Reorder Point chart. The selection of the value from the slicer will affect both the charts.
Right-click on any legend, to open the Drill Through option which navigates to a new page. The Drill Through is used to display the details of the chart with columns like Item Name, Item Number, Storeroom/Vendor, Reorder Point, High Level, Available Qty, and Unit Price.
Note: Data for this chart will be refreshed for every 24 hours.
Tip
To view the Items Below Reorder Point chart, click the Items Below Reorder Point Chart link.
Features of the Chart:
Hover over the chart to display the values of Vendor/Storeroom name and Total Items.
Show as Table: You can see the chart values in a tabular format. From the chart More Options (...), select Show as Table option. All the fields used for the chart can be shown in the table view.
Focus Mode: You can see full page view of the chart using the Focus Mode option from the chart ellipse.
Export: You can export chart data to .csv format from the Export Data option in the chart ellipse.
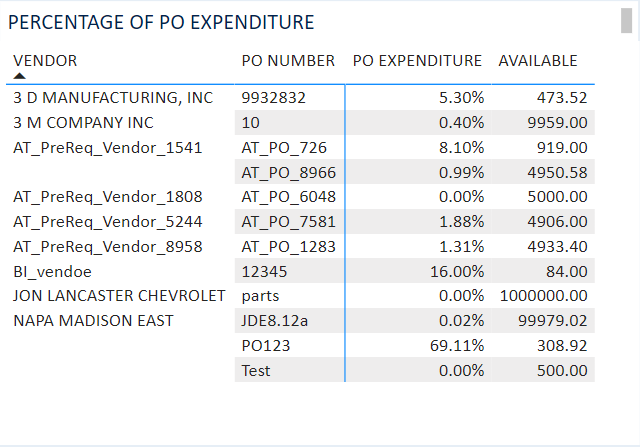
The objective of this chart is to display the details if the PO can still be used along with the amount remaining to the Inventory Personnel. A Matrix Table is used to display the Vendor, PO No, PO Expenditure, and Total Expenditure.
The condition for PO is "not Expired" (PO END DATE >= Current Data) AND PO % Expended is < 100%.
Row lists the Vendor and Its Purchase Order No
Column lists the Percentage of PO Expenditure and Available Value.
Y Axis lists the Count of Assets (It is a Distinct value).
The Drill Through table is used to see details about the Vendor. Click the plus icon on the Vendor name to get the details like PO Number with classified expenditure.
Note: Data for this chart will be refreshed for every 30 minutes.
Tip
To view the Percentage of PO Expenditure chart, click the Percentage of PO Expenditure Chart link.
Features of the Chart:
Show as Table: You can see the chart values in a tabular format. From the chart More Options (...), select Show as Table option. All the fields used for the chart can be shown in the table view.
Focus Mode: You can see full page view of the chart using the Focus Mode option from the chart ellipse.
Export: You can export chart data to .csv format from the Export Data option in the chart ellipse.
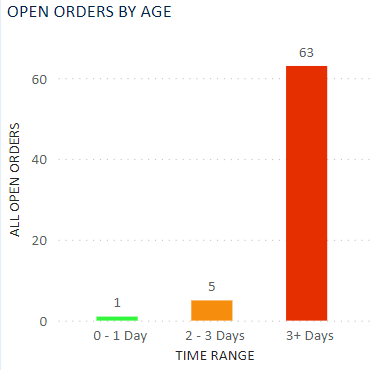
The objective of this Chart is to display current overdue orders and how old is their delivery date. This helps the Inventory personnel to understand which orders are overdue and allow them to follow up with the vendor. A Clustered Column chart is used to display the Total Overdue Days and Total Orders.
The conditions for Order Status = 'Open’ AND Delivery Date > Current Date/Time
X Axis lists Total Days and its values are 0-1 Day, 1-2 Days, 2-3 Days, and 3+ Days.
Y Axis lists Count of Overdue Orders.
Right-click on any column, to open the Drill Through option which navigates to a new page. The Drill Through is used to display the details of the chart with columns like Order No, Order date, and Due Days Range.
Note: Data for this chart will be refreshed for every 30 minutes.
Tip
To view the Open Orders by Age chart, click the Open Orders by Age Chart link.
Features of the Chart:
Hover over the chart to display the values of Time Range and Total Orders.
Show as Table: You can see the chart values in a tabular format. From the chart More Options (...), select Show as Table option. All the fields used for the chart can be shown in the table view.
Focus Mode: You can see full page view of the chart using the Focus Mode option from the chart ellipse.
Export: You can export chart data to .csv format from the Export Data option in the chart ellipse.