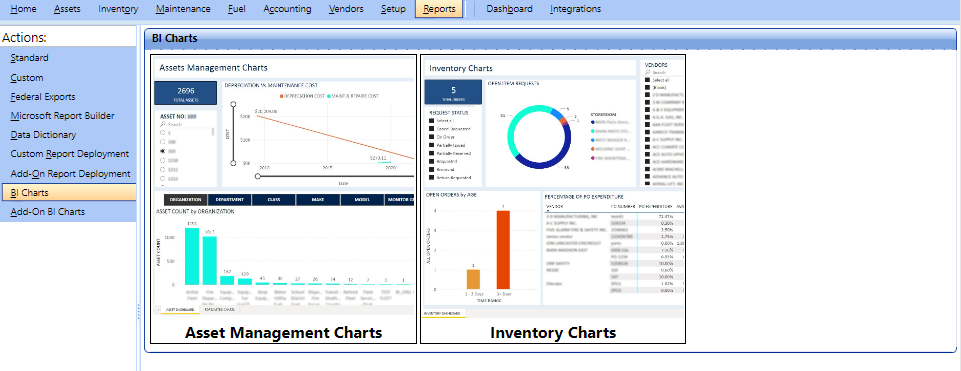
The Business Intelligence (BI) Charts section lets you view various charts that display the performance of Assets, Inventory, and many other categories. You can also view the charts in table format, drill through the details, and apply filters as per the requirement.
BI Charts provide a multi-purpose view of certain data of the FASTER Web application. These charts help you to get summarized and detailed information of data and various activities performed on assets and other categories.
The BI Charts uses various measurements, such as time, years, months, dates, and other parameters based on the chart type to display the data patterns of various elements, for example, Assets.
You can use BI Charts to manage all aspects related to Vendors, Assets, Asset repairs, financial transactions, and other applicable departments. Each section data is displayed in a visual and familiar Charts and Graphs format.
The BI Charts section displays the reports for the following:
Standard reports page